Strategy Examples
Explore the core position structures behind our real trades — risk-on, risk-off, and neutral strategies, illustrated with clear examples. We do not detail our market views for each trade here; instead, we show how structured option strategies managed risk exposure and reward-to-risk ratio, with actual results compared to expectations.
Risk-on Strategy Example 1
Aggressive Option Spread Targeting a High Reward-to-Risk Ratio
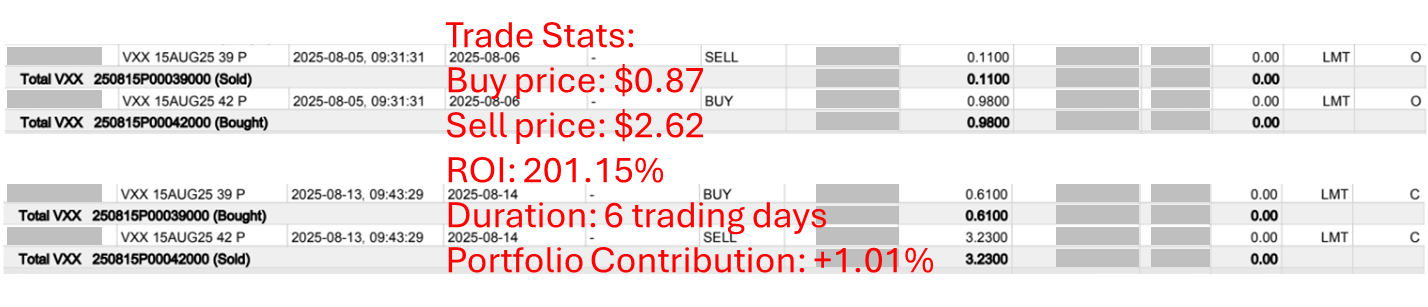
In early August 2025, our volatility-tracking indicators signaled an upcoming IV Collapse. To position for this move, we implemented an aggressive short volatility strategy using a put spread on VXX, which was trading at 42.64 at the time.
Trade Structure
Buy VXX 20250815 42 Put
Sell VXX 20250815 39 Put
The net debit was $0.87 per unit, representing the maximum risk. This meant that at expiration, VXX needed to fall to 41.13 or lower for the trade to break even—a decline of at least 3.54% within two weeks. This made the setup moderately aggressive.
Risk-Reward Profile
In return for taking this directional risk, the structure offered an attractive reward-to-risk ratio. At expiration, the spread’s maximum profit would be $2.13 per unit, versus the $0.87 risk, implying a maximum reward-to-risk ratio of 245%.
Outcome
After six trading days, we judged the trade had largely achieved its intended objective and closed the position. The final realized return was +201.15%. The total risk exposure allocated to this trade at entry was 0.5% of the Portfolio, resulting in a +1.01% contribution to the overall Portfolio upon closing.
Insight
This example highlights how risk-on strategies, when executed with structured spreads, can deliver asymmetric payoffs while keeping downside exposure strictly defined.
Risk-on Strategy Example 2
Testing the Upside at a Turning Point with Limited Risk
This trade ended in a loss, but it equally demonstrates how structured option strategies can adapt to specific market environments.
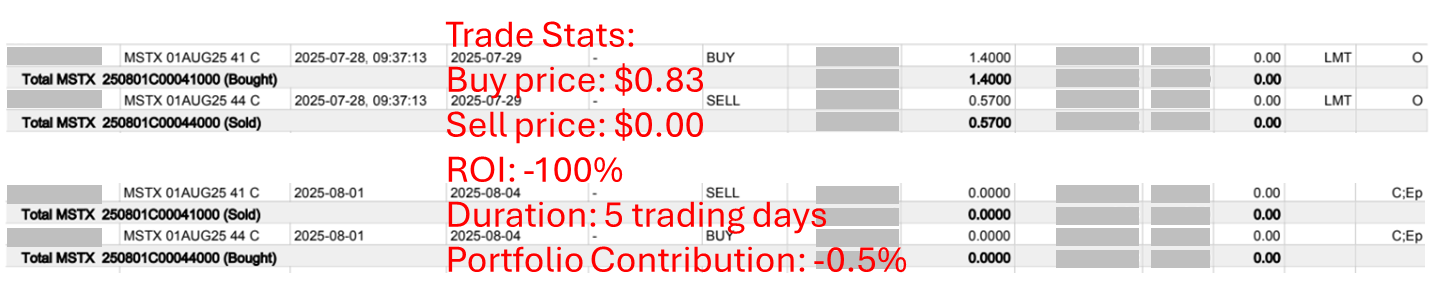
In late July 2025, after more than three months of strong upward momentum, MicroStrategy (MSTR) showed signs of a pullback. However, given MSTR’s strong correlation with Bitcoin, the stock frequently produces bear traps. To account for this, we implemented a dual-direction setup—taking positions on both the long and short sides. This example highlights the long-side position, while the short-side hedge is detailed in Risk-off Strategy Example 1.
Trade Structure
We used options on MSTX (a 2x leveraged ETF tracking MSTR), which was trading at 40.60 at the time:
Buy MSTX 20250801 41 Call
Sell MSTX 20250801 44 Call
The net debit was $0.83 per unit, representing the maximum risk. This meant MSTX needed to rise to 41.83 or higher by expiration to break even—a 3.03% increase in one week. Given MSTR’s inherent volatility and the timing near a potential inflection point, we considered this setup justified.
Risk-Reward Profile
At expiration, the spread’s maximum profit potential was $2.17 per unit, versus the $0.83 risk, implying a maximum reward-to-risk ratio of 261%. This balanced the trade’s directional risk with attractive return potential.
Outcome
Over the following week, MSTX declined by –23.84% (with MSTR itself dropping –12.07%), leading this trade to expire worthless. The realized return was a full –100% loss on the position. However, the total risk exposure allocated to this trade was capped at 0.5% of the Portfolio, so the overall Portfolio impact was contained at –0.5%. Compared with a direct long position in the stock or ETF, this structured approach significantly limited the downside.
Insight
Even losing trades underscore the defensive value of structured option strategies: defined maximum loss, limited Portfolio impact, and clear asymmetry versus holding the underlying asset outright.
Risk-off Strategy Example 1
A Safe and Efficient Way to Bet on a Post-Rally Pullback
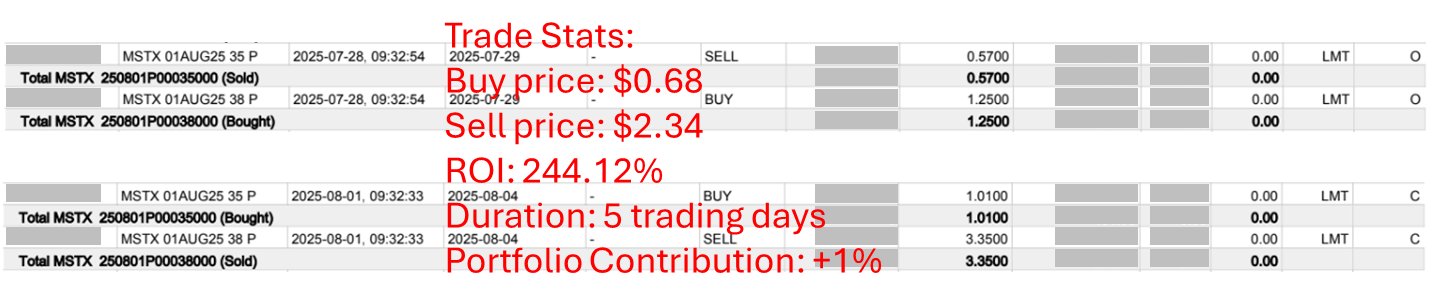
This trade represented the bearish counterpart to Risk-on Strategy Example 2, executed in late July 2025. After more than three months of strong gains, MicroStrategy (MSTR) signaled a pullback, presenting an attractive short opportunity.
We used options on MSTX, the 2x leveraged ETF tracking MSTR. At entry, MSTX was trading at 40.60. The position was structured as follows:
Trade Structure
Buy MSTX 20250801 38 Put
Sell MSTX 20250801 35 Put
The net debit was $0.68 per unit (the defined risk). For the trade to break even at expiry, MSTX needed to fall to at least $37.32, implying a required drop of –8.08% within a week. Given MSTR’s high volatility and the timing of a potential reversal, we considered this setup appropriate.
Reward-to-Risk Profile
This spread structure required a significant downside move but offered an attractive payoff profile. At expiration, the maximum potential profit was $2.32 per unit, against a risk of $0.68 with a maximum reward-to-risk ratio of 341%.
Outcome
On the final trading day before expiration, MSTX opened at 35, hitting the lower strike. We exited the position with a return of +244.12%. Since the initial risk exposure allocated for this trade was set at 0.41% of the overall Portfolio, the net contribution was +1.0%.
Insight
This trade illustrates how structured options strategies can capture asymmetric opportunities during high-volatility turning points. By pairing this bearish spread with a simultaneous bullish spread (see Risk-on Example 2), we demonstrated how taking both sides of a directional bet can balance portfolio risk. Even though the bullish leg resulted in a full loss, this short-side trade not only offset it but also generated a net gain, proving the resilience of a paired, risk-defined approach.
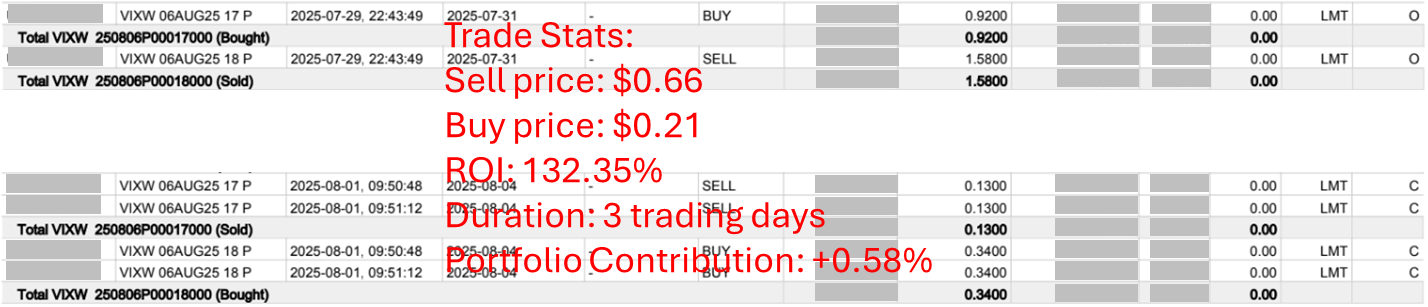
Risk-off Strategy Example 2
A Cash-in Position on Volatility Mean Reversion
This example illustrates a unique method of taking a Risk-off position. On July 29, 2025, after more than a month of declining volatility, several indicators on the VIX signaled a likely mean reversion. In other words, the VIX appeared unlikely to decline much further and instead had a higher probability of moving back toward its recent average.
Since the VIX itself is not directly tradable, we used options on the VIX futures expiring the following week. At the time of entry, the VIX futures contract was trading at 17.32. The position was:
Trade Structure
Sell VIXW 20250806 18 Put
Buy VIXW 20250806 17 Put
Reward-to-Risk Profile
We classify this type of trade as a cash-in position because it generates upfront cash upon entry. At initiation, we received a cash inflow of $0.66 per unit. Our logic was straightforward: if, at expiration the following week, the VIX futures settled at or above 18 (a gain of just 3.93% from the entry level), we would keep the full $0.66 as profit.
If the market moved against us, our maximum possible loss was $0.34 per unit (calculated as 18 – 17 – 0.66). This defined our risk exposure and produced a maximum reward-to-risk ratio of 194%.
Outcome
On August 1, as market volatility picked up, the VIX futures quickly broke above 18 at the open. We decided to lock in profits and closed the position by paying $0.21 per unit, resulting in a net gain of $0.45 per unit. This translated into an actual return of 132.35%. Since the portfolio-level risk exposure at entry was set at 0.43%, the final contribution to the overall Portfolio was +0.58%.
Insight
This trade highlights how volatility-based strategies can complement directional stock or index trades. By structuring a defined-risk, premium-collecting position, we were able to align with a mean reversion thesis while ensuring limited downside. The key takeaway is that risk-off does not always mean “staying out of the market”—sometimes it means structuring trades that let the market pay you upfront, with predefined and asymmetric payoff profiles.
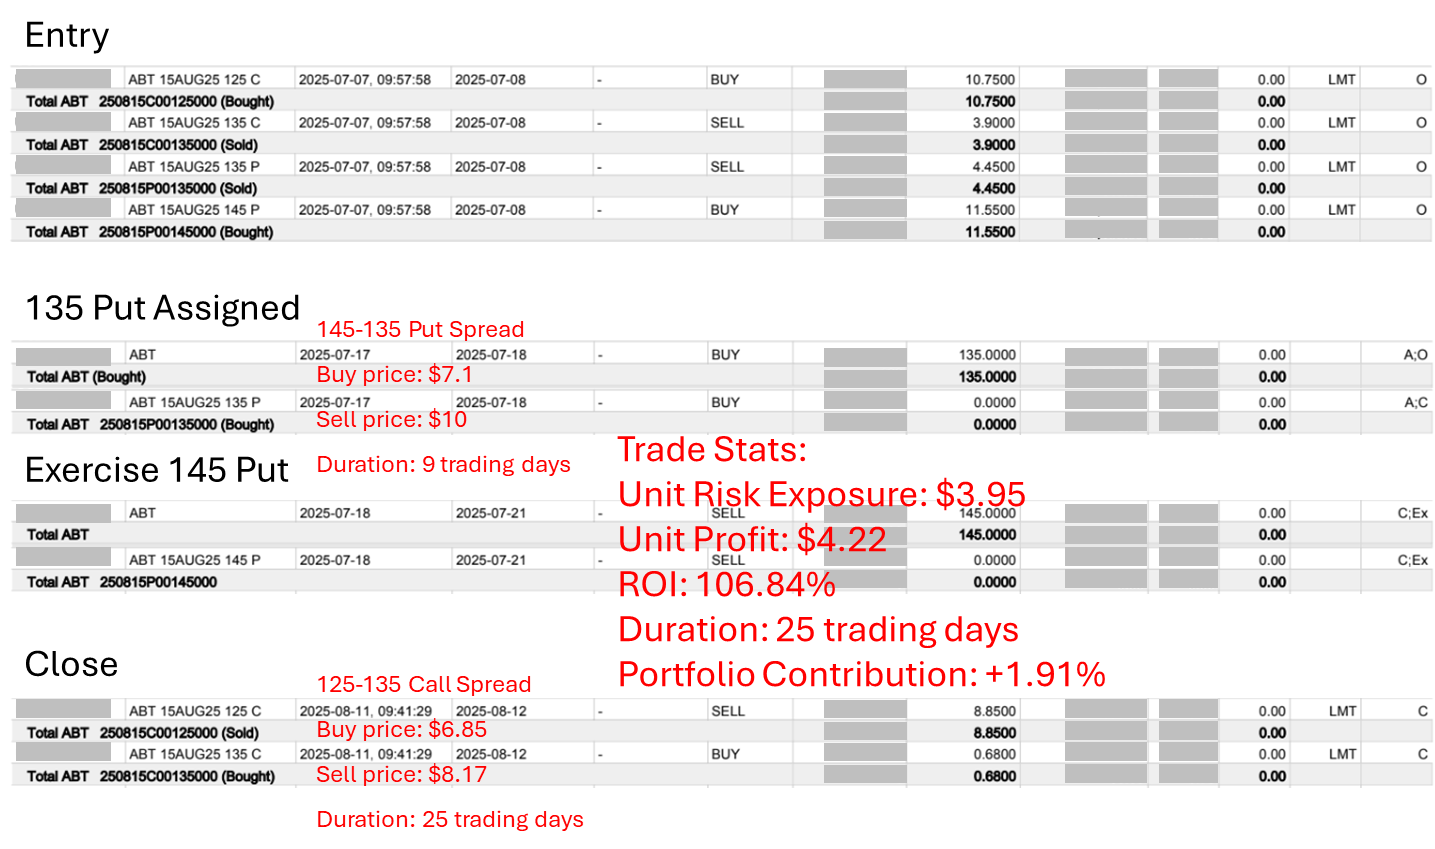
Neutral Strategy Example
Classic Butterfly Structure to Navigate Wide-Swing Market Conditions
If we expect a stock to move within a certain range for a period of time, or to fluctuate around a price level, then we can adopt a Neutral Strategy as shown in this example (see Giga Certainty Member Handbook and our tutorial video for details).
On July 7, 2025, our trading system generated a signal: Abbott (NYSE: ABT), trading around 134.51 that day, was suitable for establishing a Neutral Strategy position. Referring to the key indicators calculated by the Giga Certainty Position Manager, the actual position was as follows:
Trade Structure
Buy ABT 20250815 125 Call
Sell ABT 20250815 135 Call
Sell ABT 20250815 135 Put
Buy ABT 20250815 145 Put
Reward-to-Risk Profile
This type of option combination is called a Butterfly (for details, see our member resources). As can be seen, a Butterfly is essentially equivalent to a Call Spread plus a Put Spread.
In this position:
The 125–135 Call Spread required an initial outlay of $6.85 per unit.
The 145–135 Put Spread required an initial outlay of $7.10 per unit.
However, the actual risk exposure per unit of the Butterfly was only $3.95 (6.85 + 7.1 – 10).
If at expiration ABT was exactly at 135 (i.e., close to the current level), then each Butterfly could be sold for $20. At that point, we would earn a maximum profit of $6.05 per unit, representing a maximum reward-to-risk ratio of 153%.
Outcome
After entry, ABT’s price action became a classic case for a Neutral Strategy.
On July 17, ABT fell sharply to 120.51 (far below the Butterfly’s range), and our Sell 135 Put was exercised. The broker automatically closed the Sell 135 Put at $0 while simultaneously made us buy ABT stocks at $135 per share. Our strategy designs always take such situations into account in advance, so this not only posed no risk but was actually favorable to us. The next day, we proactively exercised our long 145 Put, which closed the Buy 145 Put at $0 while simultaneously selling ABT stocks at $145 per share. In this way, the Put Spread and the stock position were both completely closed, and on the stocks part we received $10 per share. After deducting the $7.10 cost of the Put Spread at entry, this part of the position realized the maximum profit of $2.90 per unit in just 9 trading days. At this point, the only remaining position was the Call Spread.
Subsequently, ABT began to return to the price center we had set (135). On August 11, when ABT had risen back to 134.08 at the market open—very close to the target, and with expiration approaching—we decided to close the position since most of the profit target had already been achieved. We closed the entire Call Spread at $8.17 per unit, earning $1.32 per unit.
Final Results
Total profit per unit: $4.22
Actual ROI: 106.84%
Portfolio impact: With total risk exposure set at 1.79%, the final contribution to the portfolio was +1.91%.
Insight
This trade highlights how structured option strategies can adapt dynamically to unexpected market moves. Even when ABT fell far outside the intended range, the predefined structure allowed us to capture gains from the Put Spread while still preserving profit potential from the Call Spread. Neutral strategies like this Butterfly can be powerful tools for extracting value from sideways or oscillating markets with disciplined risk control.