Prime Path Real Applications
How Prime Path structures behave in real portfolios, over real time — across calm markets, drawdowns, and stress.
These are observed applications, shared for understanding, not signals or recommendations.
Position Case Studies and Smart Applications
Includes both real positions held by Giga Certainty or contributed by active members, and creative applications derived from Prime Path Live Snapshots.
* Click the index number below (formatted as publication date + type + key words) to read the review.
2026/2/10 Position Case Study # Bitcoin # Ethereum #Live Update
2026/1/14 Smart Application # Risk-Controlled Investing # Return on Risk # Downside Protection
2026/1/15 Smart Application # Pre-Locked Yield
2026/1/20 Smart Application # Efficient Compounding
2026/2/14 Smart Application # Risk Customization
2026/3/9 Smart Application # Profit in Market Selloffs
2026/2/10 Position Case Study — Live Update
When the Market Fell Sharply, the Structure Behaved Differently — # Bitcoin # Ethereum
Below are three Prime Path positions currently held by Giga Certainty.
They are shared to illustrate what mid-period fluctuation actually looks like in real markets — not in theory.
Position Overview
IBIT (Bitcoin ETF)
Entry date: October 1, 2025
Structure:
IBIT @ $66.22 + Short Dec 17, 2027 70 Call + Long Dec 17, 2027 58 PutAt expiration:
Max Profit: 17.64% | Max Loss: -0.47% | Max RoR: 37.86
ETHA (Ethereum ETF) — First Position
Entry date: September 29, 2025
Structure:
ETHA @ $31.53 + Short Dec 17, 2027 37 Call + Long Dec 17, 2027 27 PutAt expiration:
Max Profit: 30.32% | Max Loss: -1.46% | Max RoR: 20.74
ETHA (Ethereum ETF) — Second Position
Entry date: October 1, 2025
Structure:
ETHA @ $32.51 + Short Dec 17, 2027 38 Call + Long Dec 17, 2027 29 PutAt expiration:
Max Profit: 27.35% | Max Loss: -0.40% | Max RoR: 68.23
What Happened After Entry
After these positions were established, both IBIT and ETHA declined sharply.
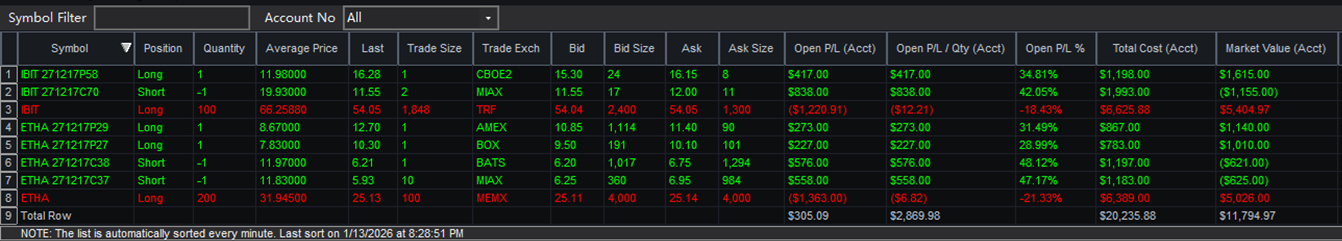
By January 13, 2026:
IBIT was down -18.43%
ETHA was down -21.33%
For a traditional stock or ETF holder, this would already represent a painful drawdown.
However, on that same day, all three Prime Path positions were still showing unrealized gains as complete structures.
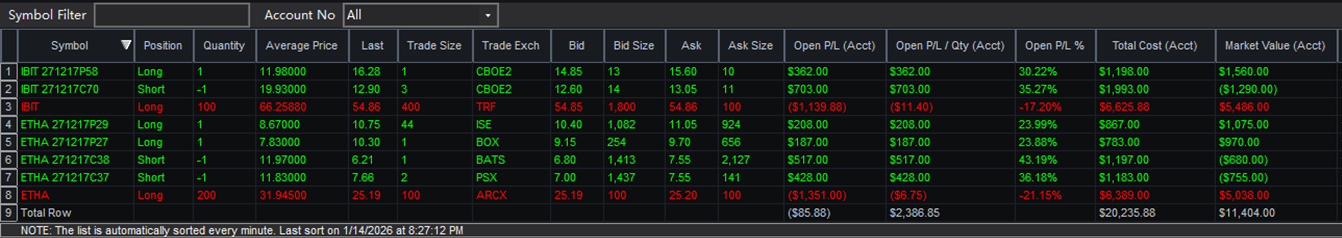
One day later, on January 14, 2026:
IBIT’s decline narrowed to -17.20%
ETHA’s decline narrowed to -21.15%
From a price perspective, “the market looked slightly better.”
Yet paradoxically, the Prime Path positions as a whole shifted into small unrealized losses.
This contrast highlights a core reality of Prime Path:
The direction of price movement ≠ the direction of structural P&L
Changes in unrealized P&L ≠ the final outcome at expiration
During the holding period, what you see on the screen mainly reflects option pricing, volatility expectations, and short-term market sentiment — not the final answer.
As long as the structure itself has not been broken, the relevant reference points remain unchanged: Max Profit, Max Loss, and Breakeven at expiration.
A More Extreme Phase

Entering February 2026, the crypto market experienced a severe collapse.
As of February 5, 2026:
IBIT was down -45.73%
ETHA was down -55.77%
For most investors, this level of drawdown would be extremely difficult — if not impossible — to tolerate.
Yet because these exposures were held inside Prime Path structures, the combined unrealized loss across all three positions was approximately -3.76%.
It is important to note:
this unrealized loss temporarily exceeded the original expiration-based Max Loss levels defined at entry.
However, this does not automatically imply structural failure.
What this reflected was the market’s instantaneous repricing of volatility and risk sentiment, not a change in the expiration logic — provided that IBIT and ETHA themselves continue to function normally and no extreme non-price events occur.
Under those conditions, the positions can still be held calmly toward expiration.
Ongoing Disclosure
These Prime Path positions have a final expiration date of December 17, 2027.
We will continue to update this page over time, documenting how the structures behave across different market phases — including calm periods, stress periods, and, if they occur, Extreme Scenarios as defined in the Member Handbook.
This case is not shared to demonstrate profits.
It exists to show how a structured risk framework behaves in the real world, over real time, under real pressure.
2026/1/14 Smart Application
The Most Common Use of Prime Path — # Risk-Controlled Investing # Downside Protection # Real Return
For most long-term investors, the biggest challenge is not finding opportunities — it is controlling risk while staying invested.
Traditional investing forces a difficult trade-off:
If you want meaningful returns, you must accept large drawdowns.
If you want safety, you often sacrifice real return potential.
Prime Path structures are designed to solve this dilemma by locking in a clearly defined maximum risk, while still allowing investors to pursue attractive long-term outcomes.
Below are two real examples that illustrate this core application.
Case 1 — NVDA (NVIDIA Corp), 2-Year Structure
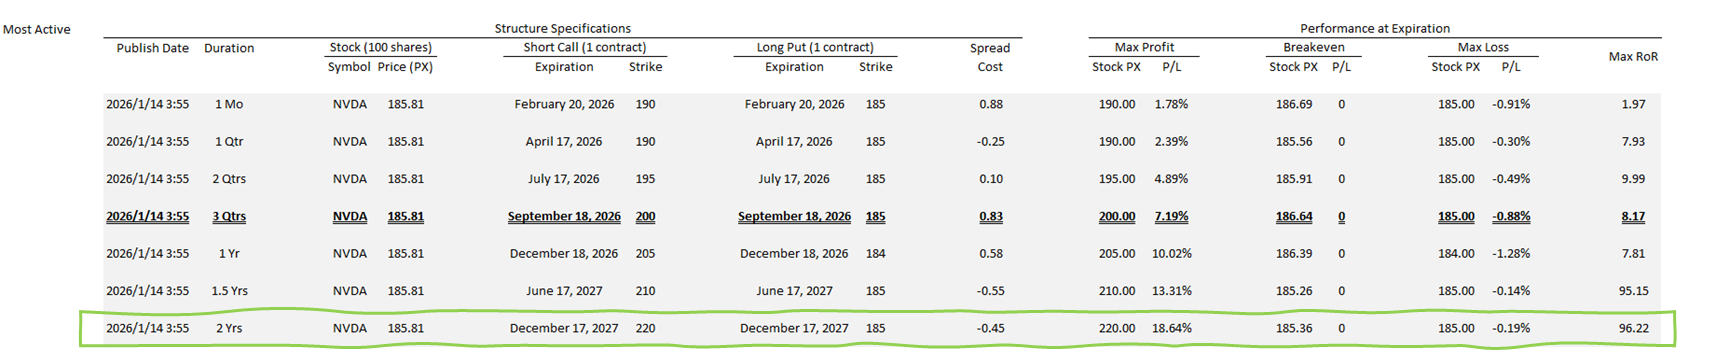
Publish Date: Jan 14, 2026
Structure:
NVDA @ $185.81 + Short Dec 17, 2027 220 Call + Long Dec 17, 2027 185 Put
At Expiration:
Max Profit: 18.64% | Max Loss: -0.19% | Max RoR: 96.22
What this shows
This structure demonstrates one of the most distinctive features of Prime Path:
The investor remains fully exposed to long-term upside within a defined range.
The maximum possible loss at expiration is tightly capped at less than 0.2%.
The resulting Return-on-Risk ratio becomes exceptionally high, because the downside is strictly limited from the outset.
In traditional long-only investing, achieving a nearly 100:1 reward-to-risk profile is practically impossible without leverage or speculation.
Case 2 — TSLA (Tesla Inc), 2-Year Structure
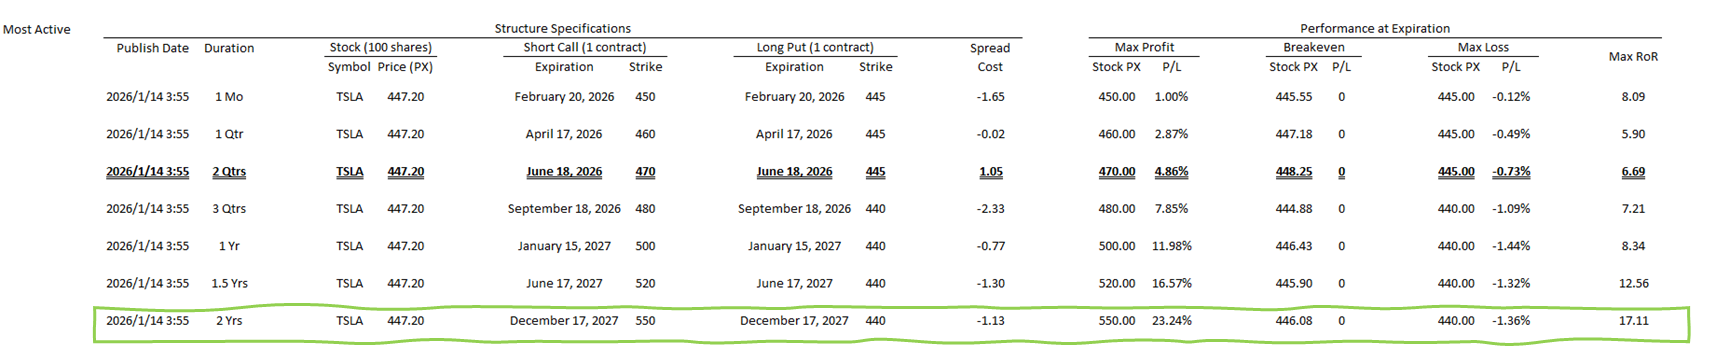
Publish Date: Jan 14, 2026
Structure:
TSLA @ $447.20 + Short Dec 17, 2027 550 Call + Long Dec 17, 2027 440 Put
At Expiration:
Max Profit: 23.24% | Max Loss: -1.36% | Max RoR: 17.11
What this shows
This case reflects a more typical Prime Path configuration:
The investor accepts a slightly wider downside boundary.
In exchange, the structure allows higher absolute return potential.
The maximum risk remains precisely defined from day one.
Compared to traditional long-term investing — where drawdowns of 30-50% are common — a clearly capped loss around 1% represents a fundamentally different risk profile.
The Core Idea Behind This Application
These examples illustrate the most common way investors use Prime Path:
1. Stay invested in high-conviction assets — Rather than timing entries and exits, investors can maintain long-term exposure.
2. Lock in a maximum risk upfront — The worst-case outcome at expiration is known and controlled in advance.
3. Pursue real return with discipline — Instead of relying on leverage or aggressive position sizing, Prime Path improves outcomes by optimizing risk structure, not by increasing risk.
Important Notes
Prime Path structures are not predictions of future price movements.
They are risk-defined strategic frameworks designed to help investors:
Understand their potential outcomes clearly
Align positions with their risk tolerance
Maintain discipline during long investment horizons
Actual results will depend on market conditions, execution quality, and individual decisions regarding position management.
2026/1/15 Smart Application
A Rare Prime Path Pattern: “Pre-Locked Yield” Structures
Occasionally, certain Prime Path structures display an unusually distinctive profile at the moment they are published. In Live Snapshots, you'll notice that some highlighted rows show identical positive values for Max Profit and Max Loss at expiration, with Max RoR equal to 1.
In these rare cases, when both the Call and Put are set at the same strike price, the options combination may generate such a large net credit that the position effectively locks in a positive outcome at expiration — regardless of how the underlying price moves.
We refer to this special type of structure as:
Pre-Locked Yield Prime Path
This does not mean risk disappears.
Rather, it means the expiration outcome is largely determined upfront, within the normal assumptions of market functioning.
What Makes This Pattern Unique
Unlike typical Prime Path positions, which define a range between maximum profit and maximum loss, these structures behave differently:
• The expiration outcome becomes fixed rather than variable
• Market direction has minimal impact on final P&L
• The primary uncertainty lies in market functioning, not price movement
In essence, the position behaves more like a pre-agreed yield contract than a directional investment.
Case 1 — PBR (Petroleo Brasileiro), 1-Month Structure

Publish Date: Jan 15, 2026
Structure:
PBR @ $12.66 + Short Feb 20, 2026 12 Call + Long Feb 20, 2026 12 Put
Spread Cost: -$0.75 (Net Credit: $0.75)
At Expiration:
Regardless of where PBR trades, the structure effectively locks in a final sale price at $12 for PBR stocks.
Resulting outcome:
Locked Return: ≈ +0.71% in one month
Case 2 — VALE (Vale SA), 1-Month Structure

Publish Date: Jan 15, 2026
Structure:
VALE @ $14.61 + Short Feb 20, 2026 14 Call + Long Feb 20, 2026 14 Put
Spread Cost: -$0.69 (Net Credit: $0.69)
At Expiration:
The structure similarly locks in a fixed outcome.
Locked Return: ≈ +0.5% in one month
Why These Situations Occur
These rare setups typically arise when:
• Option markets temporarily price in extreme short-term uncertainty
• Demand for downside protection surges
• Volatility premiums become unusually elevated
Prime Path does not create these conditions — it simply provides a structured way to observe and potentially utilize them.
Important Perspective
Pre-Locked Yield structures do not eliminate risk.
They still rely on:
• Normal market functioning
• Continued trading liquidity
• Absence of extreme non-price events
What they demonstrate is something more subtle:
Sometimes, market conditions allow uncertainty to be priced so aggressively that a structured position can transform volatility into a predefined outcome.
These situations are uncommon — but when they appear, they represent one of the clearest illustrations of how Prime Path can reshape risk exposure.
2026/1/20 Smart Application
Using Prime Path for Short- to Mid-Term Opportunities — # Efficient Compounding
Most Prime Path structures are designed with long-dated expirations to support stable, disciplined participation.
However, within each Prime Path Live Snapshot, you will often find 1-month or 3-month structures that show a good balance across all three key metrics:
Clearly constrained downside
Meaningful, defined upside
Attractive Return-on-Risk
For members who hold short- to mid-term market views, these structures can provide a unique advantage:
👉 The ability to pursue efficient compounding — without exposing capital to open-ended risk.
This is not about trading more frequently.
It is about participating more efficiently when conditions allow.
Below are real examples published in Prime Path Live Snapshots.
Case 1 — KRE (SPDR S&P Regional Banking ETF), 1-Month Structure

Publish Date: Jan 14, 2026
Structure:
KRE @ $66.24 + Short Feb 20, 2026 67 Call + Long Feb 20, 2026 66 Put
At Expiration:
Max Profit: 1.37% | Max Loss: -0.14% | Max RoR: 9.53
This structure provided a very tight loss boundary while preserving a meaningful short-term upside window.
Case 2 — NFLX (Netflix Inc), 3-Month Structure

Publish Date: Jan 14, 2026
Structure:
NFLX @ $90.32 + Short Apr 17, 2026 94 Call + Long Apr 17, 2026 90 Put
At Expiration:
Max Profit: 3.74% | Max Loss: -0.69% | Max RoR: 5.45
A longer short-term horizon allowed for higher absolute return potential while maintaining a clearly defined risk boundary.
Case 3 — SLV (iShares Silver Trust), 1-Month Structure

Publish Date: Jan 20, 2026
Structure:
SLV @ $85.39 + Short Feb 20, 2026 87 Call + Long Feb 20, 2026 85 Put
At Expiration:
Max Profit: 1.89% | Max Loss: -0.46% | Max RoR: 4.13
This example demonstrates how even very short-dated structures can still maintain balanced risk-reward characteristics.
What This Application Shows
These cases illustrate an important principle:
Prime Path is not limited to long-term positioning.
When suitable structures appear, it can also serve as a disciplined framework for:
Expressing shorter-term market views
Constraining downside in fast-moving conditions
Supporting steady, repeatable compounding
The key is not frequency —
but selectivity and structure quality.
2026/2/14 Smart Application
When Higher Return Targets Don’t Have to Mean Unlimited Risk — # Risk Customization
Most Prime Path structures published in Live Snapshots are designed with a very strict objective:
Keep maximum downside extremely small (typically around –1%).
This creates a highly disciplined baseline suitable for long-term consistency.
However, not all investors share the same risk tolerance.
Some participants may have a strong long-term conviction in a specific asset — and are willing to accept a larger, predefined downside in exchange for meaningfully higher upside potential.
This case study illustrates how Prime Path can be calibrated to different risk levels, while still maintaining clearly defined boundaries.
The Core Idea: Risk Can Be Adjusted — Not Removed
Instead of increasing risk through leverage or uncontrolled exposure,
Prime Path allows risk to be intentionally selected and capped.
In this example, we designed three predefined risk tiers for TSLA:
• Low-risk level: Max Loss ≈ –1%
• Medium-risk level: Max Loss ≈ –5%
• Higher-risk level: Max Loss ≈ –10%
Each tier was paired with multiple expiration horizons.
Below are representative structures that show the trade-off dynamics.
Case — TSLA (Tesla Inc), Risk Customization
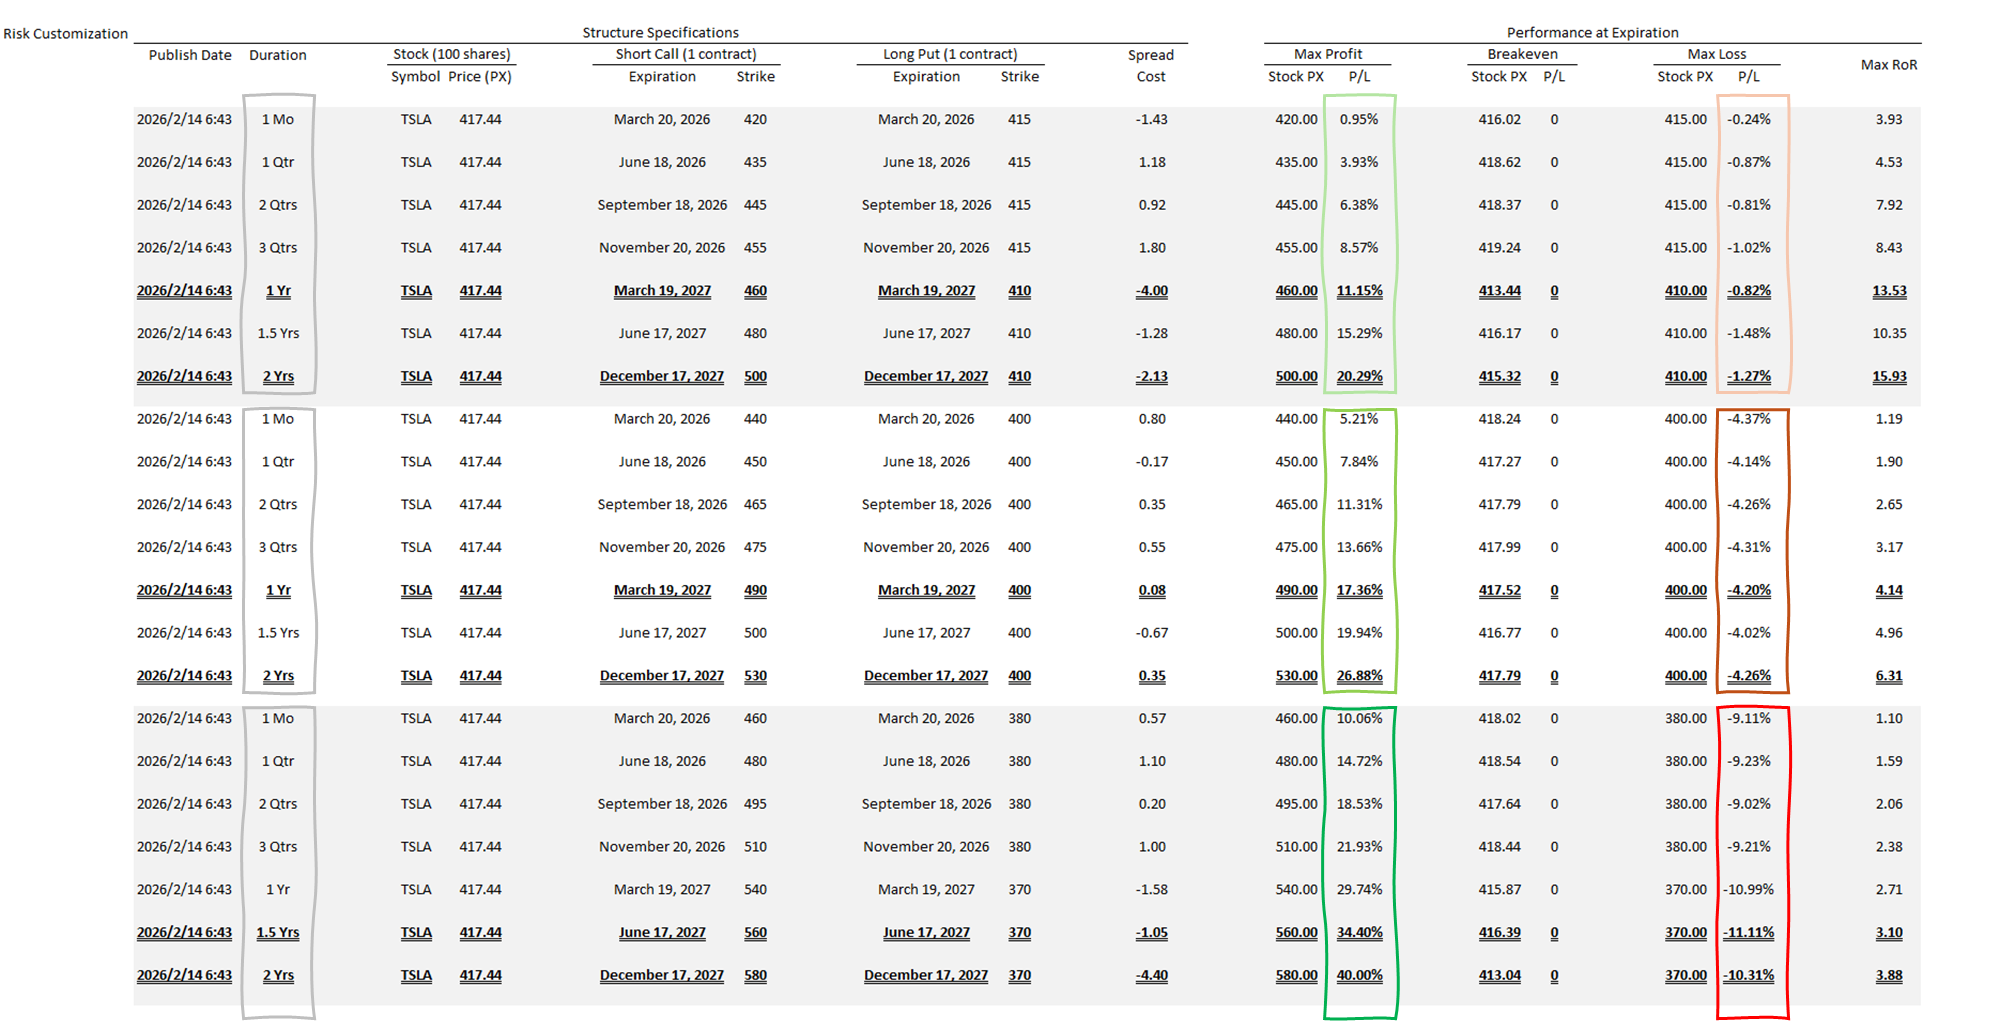
Publish Date: Feb 14, 2026
Risk Level: About –1%
Prime Path Example 1
TSLA @ $417.44 + Short Mar 19, 2027 460 Call + Long Mar 19, 2027 410 Put
Spread Cost: –$4.00
At Expiration:
Max Profit: 11.15% | Max Loss: –0.82% | Max RoR: 13.53
Prime Path Example 2
TSLA @ $417.44 + Short Dec 17, 2027 500 Call + Long Dec 17, 2027 410 Put
Spread Cost: –$2.13
At Expiration:
Max Profit: 20.29% | Max Loss: –1.27% | Max RoR: 15.93
Risk Level: About –5%
Prime Path Example 3
TSLA @ $417.44 + Short Mar 19, 2027 490 Call + Long Mar 19, 2027 400 Put
Spread Cost: $0.08
At Expiration:
Max Profit: 17.36% | Max Loss: –4.20% | Max RoR: 4.14
Prime Path Example 4
TSLA @ $417.44 + Short Dec 17, 2027 530 Call + Long Dec 17, 2027 400 Put
Spread Cost: $0.35
At Expiration:
Max Profit: 26.88% | Max Loss: –4.26% | Max RoR: 6.31
Risk Level: About –10%
Prime Path Example 5
TSLA @ $417.44 + Short Jun 17, 2027 560 Call + Long Jun 17, 2027 370 Put
Spread Cost: –$1.05
At Expiration:
Max Profit: 34.40% | Max Loss: –11.11% | Max RoR: 3.10
Prime Path Example 6
TSLA @ $417.44 + Short Dec 17, 2027 580 Call + Long Dec 17, 2027 370 Put
Spread Cost: –$4.40
At Expiration:
Max Profit: 40.00% | Max Loss: –10.31% | Max RoR: 3.88
What This Comparison Reveals
As the allowed risk level increases:
• Maximum potential returns rise significantly
• Return on Risk (RoR) declines moderately
• Downside remains clearly bounded
This is fundamentally different from conventional investing, where pursuing higher returns usually requires exponentially increasing exposure and uncertainty.
Risk-customized Prime Path structures demonstrate a different philosophy:
Higher return targets can be pursued without abandoning defined risk boundaries.
A Key Structural Advantage
Consider the –5% risk example:
TSLA @ $417.44 + Short 490 Call + Long 400 Put
If TSLA falls below the lower boundary ($400) near expiration:
• The full structure can be closed, locking in roughly a –4.2% loss.
If the investor still maintains a strong long-term bullish view:
• The stock can be retained
• The options structure can be closed independently
Because the option combinations would be profitable in this scenario, this flexibility may create an additional upside tail if the stock later recovers.
However, such decisions remain entirely discretionary and depend on individual judgment and responsibility.
Important Positioning
Risk-customized Prime Path structures:
• Are not part of standard Live Snapshot releases
• Are not designed for general subscribers
• Do not change the core philosophy of Prime Path
They simply illustrate that risk boundaries can be intentionally adjusted when required.
Availability of Custom Design Service
For investors with specific requirements, Giga Certainty offers an independent, one-time custom design service.
This service is:
• Not subscription-based
• Not included in membership by default
• Delivered per request and per specification
Typical customization inputs may include:
• Target expiration horizon (e.g., 1 year)
• Maximum acceptable loss at expiration (e.g., –5%)
• Underlying asset of interest
How to Request a Custom Prime Path
Please email:
team_gc@yoursuccessreport.com
Suggested subject line:
Risk-customized Prime Path: TSLA 1Yr –5%
The Bigger Lesson
Prime Path does not eliminate risk.
It transforms risk into something measurable, selectable, and bounded.
This case study shows that even when investors choose to accept larger downside potential, they can still do so within a structured framework — rather than through uncontrolled exposure.
2026/3/9 Smart Application
Capped-Risk Bearish Exposure — How Prime Path Profits in Market Selloffs — # Market Stress Tool
Most Prime Path structures are designed for disciplined participation in long-term upside opportunities.
However, Prime Path can also serve another purpose that is often overlooked:
Providing structured participation during periods of market stress.
When markets decline sharply, some investors may wish to express a bearish view.
But traditional short-selling strategies often involve unlimited risk or highly volatile outcomes.
Prime Path offers an alternative approach.
Rather than maximizing downside profits, the objective is different:
👉 Participate in bearish conditions while keeping downside strictly bounded.
This example illustrates how the Market Stress Tools section of Prime Path Live Snapshots can sometimes provide such opportunities.
Market Context
Shortly after the structure below was published, geopolitical tensions escalated into a military conflict between the United States and Iran.
Global markets experienced broad declines.
From Feb 15 to Mar 20, 2026, approximate market performance was:
S&P 500: about –5% to –7%
NASDAQ Composite: about –7% to –9%
NVIDIA (NVDA): about –10% to –15%
Tesla (TSLA): about –8% to –10%
Gold: about –2% to –4%
Bitcoin: about –18% to –25%
Ethereum: about –20% to –30%
During this period, risk assets broadly weakened while defensive positioning increased.
Case — SH (ProShares Short S&P 500 ETF), 1-Month Structure
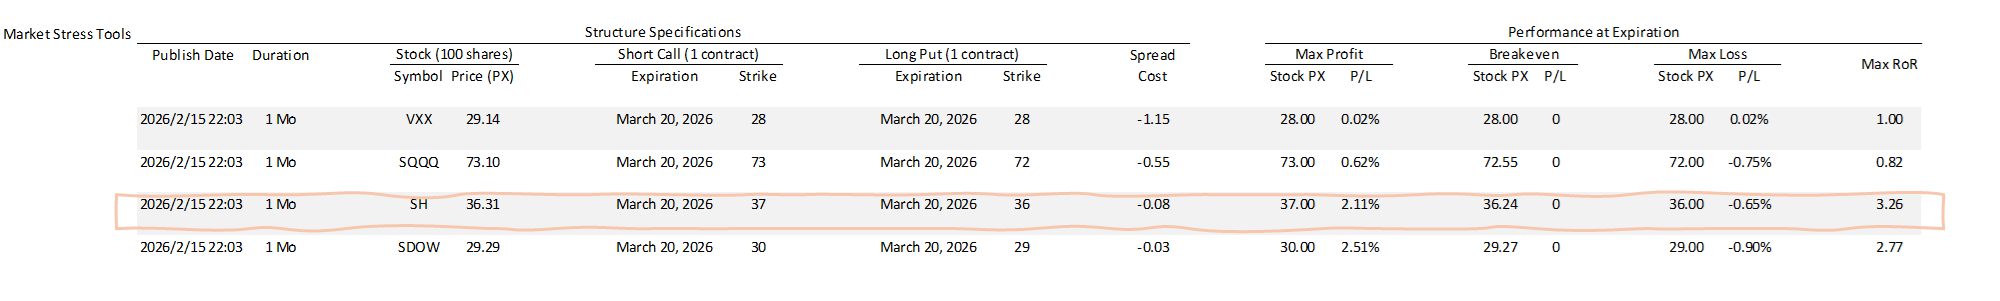
Publish Date: Feb 15, 2026
Structure:
SH @ $36.31 | Short Mar 20, 2026 37 Call | Long Mar 20, 2026 36 Put
Spread Cost: –$0.08 (Net Credit: $0.08)
At Expiration:
Max Profit: 2.11% | Max Loss: –0.65% | Max RoR: 3.26
At the time of publication, the Max RoR did not reach the usual Prime Path Highlight threshold, but the structure still maintained acceptable risk characteristics.
It is also worth noting that Prime Path structures designed for bearish exposure (such as long inverse ETFs or VIX-related instruments) typically show lower Return-on-Risk compared with bullish equity structures.
Performance After Publication
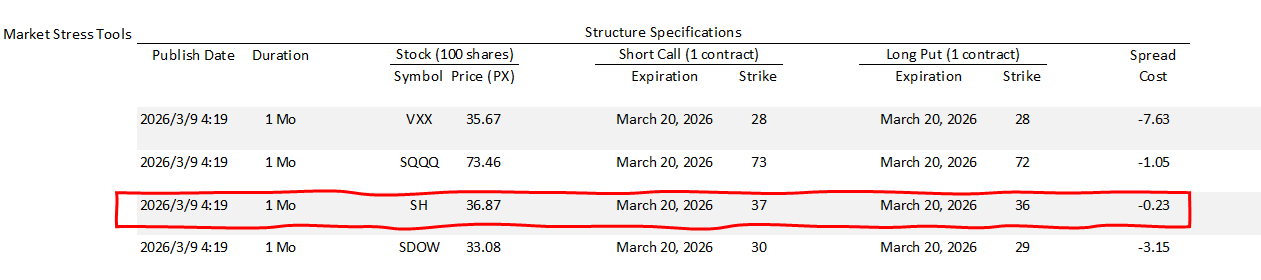
By March 6, 2026, the market decline had lifted the price of SH.
Market snapshot:
SH @ $36.87
Option spread value:
Short Mar 20, 2026 37 Call | Long Mar 20, 2026 36 Put
Spread Price: –$0.23
If the entire structure were closed at this point:
Stock Profit:
$36.87 – $36.31 = +$0.56
Options Loss:
–0.23 – (–0.08) = –$0.15
Net Result:
Total Profit: $0.41
Return over roughly three weeks:
≈ +1.13%
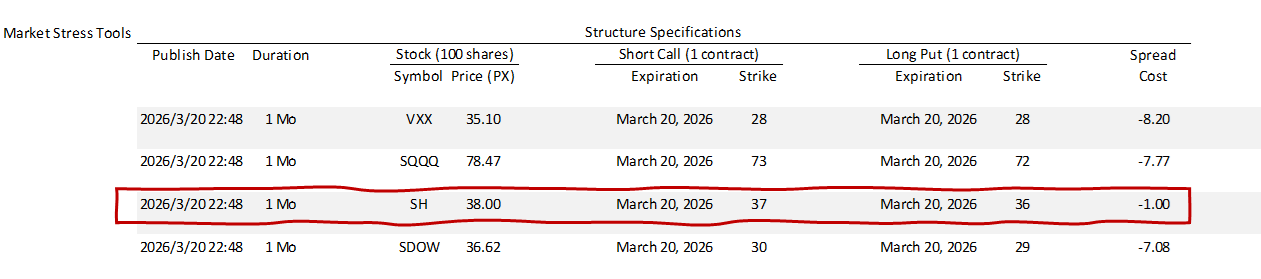
At expiration on March 20, 2026, the market declined further, and the inverse ETF used to express the bearish view (SH) moved beyond the target range.
Market snapshot:
SH @ $38
Option spread value:
Short Mar 20, 2026 37 Call | Long Mar 20, 2026 36 Put
Spread Price: –$1.00
At this point, the full structure showed the following result:
Stock Profit:
$38 – $36.31 = +$1.69
Options Loss:
–1.00 – (–0.08) = –$0.92
Net Result:
Total Profit: $0.77
As a result, the position achieved its originally defined maximum profit at entry,
equivalent to approximately +2.12% over five weeks.
What Happens at Expiration
At expiration, no action was required.
Since the price of SH moved above the strike price of the short call leg:
• The broker automatically assigned a short SH position
• This position fully offset the SH shares held in the structure
As a result, the entire position was closed through the standard expiration process.
For a detailed explanation of this mechanism, please refer to the Prime Path Member Handbook.
What This Example Shows
This case highlights an important aspect of Prime Path:
Even during broad market declines, structured opportunities may still exist.
While these structures typically do not generate the large gains sought by aggressive short sellers, they offer something different:
• Clearly defined risk
• Controlled participation in bearish conditions
• Disciplined positioning during volatile markets
For most long-term investors, such bounded exposure may be far more practical than traditional short strategies.
A Practical Observation About Market Stress Tools
An interesting pattern often appears in the Market Stress Tools section of Prime Path Live Snapshots.
When markets are stable or rising strongly:
• Most structures in this section tend to show unattractive metrics
• Max Profit, Max Loss, and Max RoR may all appear less compelling
In such periods, many of these setups are not worth pursuing.
However, when market stress begins to emerge:
• Risk metrics in this section may start to improve noticeably
This can occasionally signal structured opportunities to participate in market downside with limited risk.
For this reason, maintaining continuous access to Prime Path Live Snapshots may allow investors to recognize these windows when they appear.
The Broader Lesson
Prime Path is not only a framework for participating in rising markets.
It can also serve as a disciplined tool during market downturns.
Instead of relying on aggressive short positions, investors may sometimes choose a different path:
Participate in market stress — while keeping risk clearly bounded.
